From Code to Context: Interpreting 21 Million Rows of CRISPR Data
In a recent post, I detailed the “how” of unpivoting 21 million rows of genomic data using DuckDB. Since then, the project has matured significantly. I’ve implemented Dagster for orchestration and moved the compute to a Spark-on-Delta Lakehouse architecture.
In data engineering, architectural complexity is often a tax, and sometimes you do not know if it will pay off until you are further along the project. I probably spent more time on just JVM memory issues than I did on the whole previous post. However, once I had the Spark job running and managed by Dagster, measuring and validating the data became straightforward.
Understanding the Bioinformatics Benchmarks
For those coming from a pure data engineering background, genomic “Effect Scores” can be opaque. When scientists use CRISPR, they are essentially “deleting” a gene from a cell’s DNA to see if the cell survives.
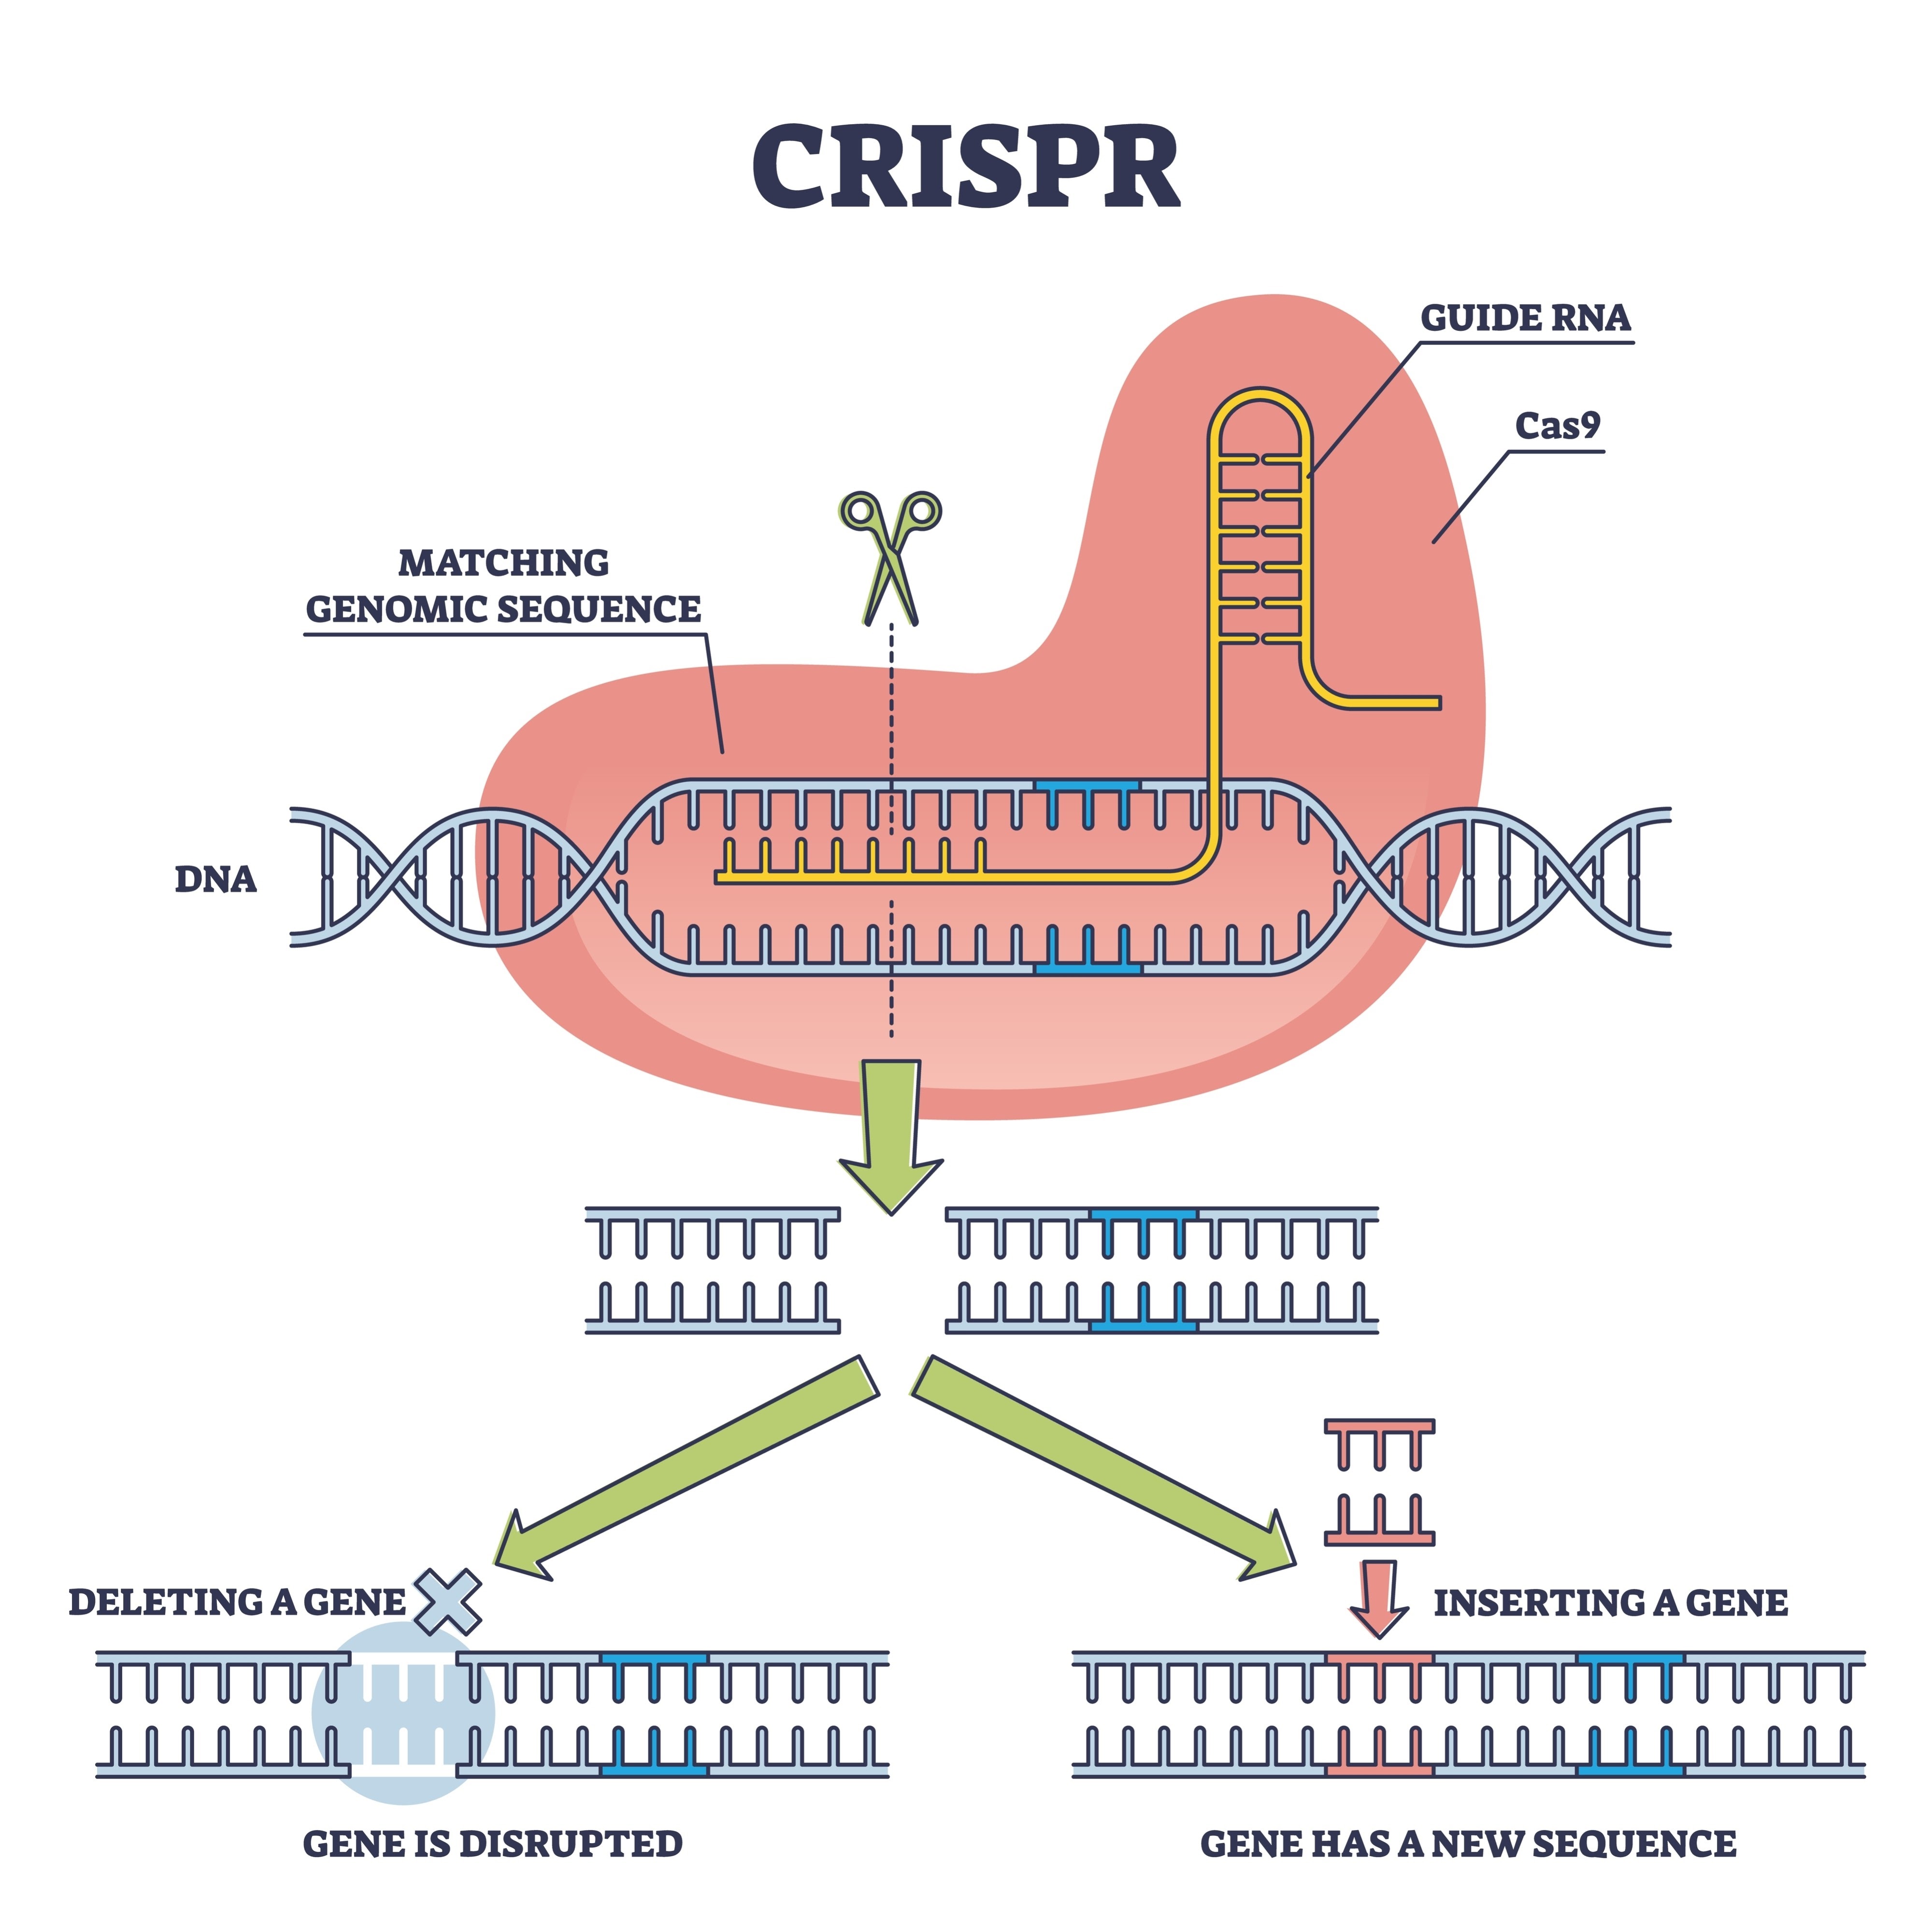
The result is a Dependency Score:
- 0.0 (Neutral): Deleting the gene had no impact.
- -1.0 (Essential): This is the “kill switch” threshold; the gene is necessary for life.
To ensure my new architecture hadn’t corrupted the data during the transition to a relational “Gold” layer, I used Spark to aggregate the scores for all 17,000+ genes across 1,100+ cancer cell lines.
The Results: A Biological “Sanity Check”
The results from the pipeline were striking:
- RPL15: -5.69
- SNRPD3: -5.47
- RAN: -4.23
If you aren’t a biologist, these look like random strings. But to a Bioinformatician, they are Common Essentials—the “housekeeping” genes.
RPL15 builds ribosomes (protein factories), and SNRPD3 handles RNA processing. Because these scores are so extreme (well beyond -1.0), we know these genes are “pan-essential.” Seeing these known biological truths at the top of the list validates the entire engineering stack. It proves the unpivot logic is mathematically sound.
The State of the Industry
In modern bioinformatics, identifying a common essential like SNRPD3 is a baseline check. The industry value lies in Selective Essentials—genes that are lethal in specific cancer subtypes but neutral in healthy tissue. By paying the “complexity tax” to move to Spark and Dagster, we’ve built the engine necessary to find those needles in the 21-million-row haystack.
From Validation to Integration
The move to a searchable Lakehouse was the “Foundational” step required to hit the goals I set in my first post:
- Multi-Omics Integration (Spark Joins): Now that the data is in a Delta Lake, we can perform massive distributed joins with the GWAS Catalog or TCGA mutation data. This allows us to prioritize “High-Confidence” targets where a genetic variant in a patient population matches a high dependency score in the lab.
- Regulatory-Ready Data (Delta Versioning): Moving toward SDTM compliance requires more than just a table; it requires audit trails. Delta Lake’s “Time Travel” and versioning provide the traceability needed for research hits to eventually move toward clinical submissions.